The use of weather data in modelling and forecasting
There is no shortage of industries that are influenced, in one way or another, by the weather. Those in the energy industry are well aware of the effects the weather has both on the demand for energy — as we try to keep our homes warm and well-lit — and, increasingly, on the generation of electricity from renewable sources such as wind and solar. In retail and FMCG, it is well known that consumers’ spending patterns are impacted by the weather. When coupled with the rich trove of data that can be obtained to describe the weather, it is perhaps not surprising that organisations are taking an increasing interest in the insights and value that can be gained through incorporating the weather into data-driven models.
Whilst weather data has been collected for a long time, recent advances with new and upgraded satellites enable weather data to be collected with greater sensitivity and resolution. This data allows more accurate weather forecasts to be calculated, and therefore the quality of both actual and forecast weather data has improved. Alongside these practical technological improvements, the rise of big data analytics has created the tools for large weather data sets to be analysed with sophisticated models. For example, machine learning models can predict consumer demand in different geographical locations based upon high spatial resolution weather data.
As with any data-based methodology, the robustness of the insights that mathematical models can afford from using weather data depends crucially both on:
- Having a clear understanding of the information you wish to obtain from the data.
- Respecting any limitations on what the data can tell you.
In practice, this means asking questions such as: Is the data I have suitable for the problem at hand (such as having appropriate temporal and geographical resolution)? Should I use actual historical values or forecasts? How do the uncertainties inherent in weather forecasts propagate through my model? And which measurements of the weather should I be using amongst the somewhat bewildering array that I could potentially have at my disposal?
What follows are considerations that can guide the process of using weather data in mathematical models.
Which data should I use?
Although it may seem obvious, it’s important to be clear from the outset on the purpose of the model one is hoping to construct with weather data. Is the intention to make forecasts, or to provide explanation to historical observations? The answer to this question has implications for whether to use forecast or actual/historical weather data in the model.
Forecast data vs actual data
Weather data is typically available in the form of both actual observations (‘actuals‘) and forecasts, and care needs to be taken when deciding whether to use actuals or forecasts in models. Two golden rules to follow are:
- You can only use the information you have available at the time of prediction or observation.
- Where there is a choice of using an actual or a forecast, consider which is more appropriate for the application at hand.
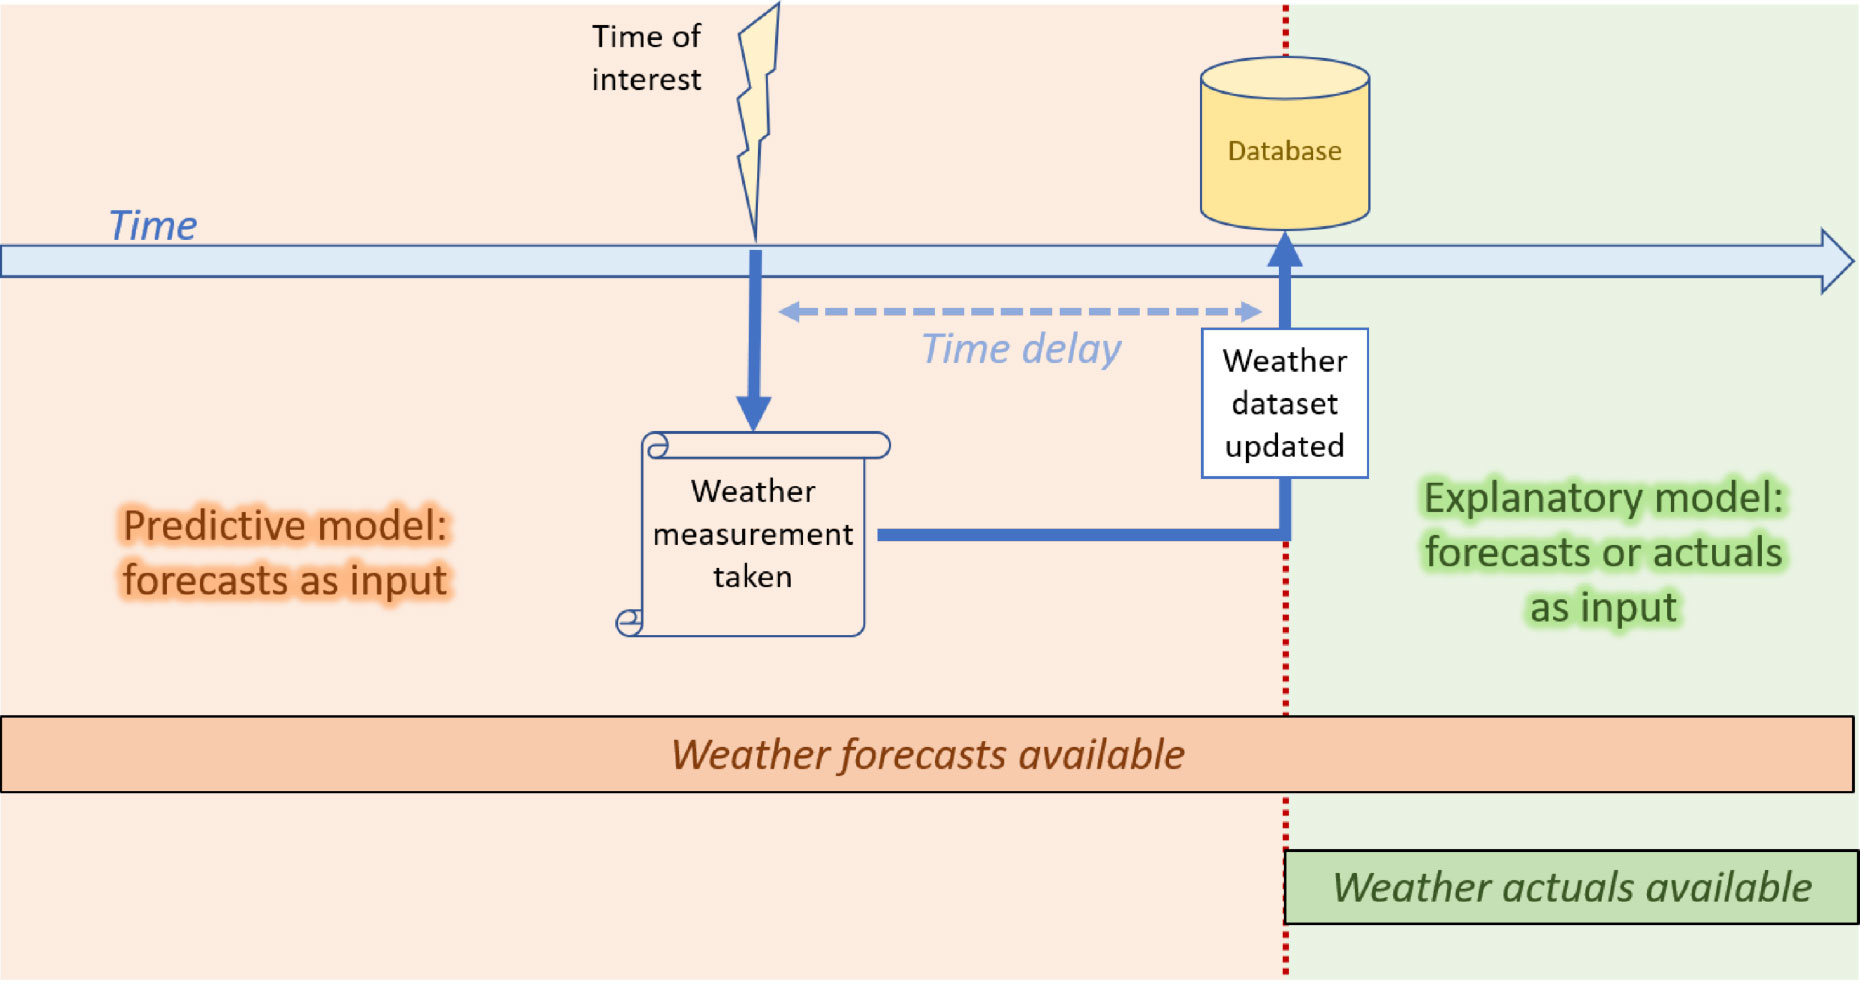
For the first rule, there are both practical and theoretical aspects to consider. On the practical side, a user will only be able to use information they physically have to hand when running the mathematical models, which will be determined by how frequently their weather data is refreshed. For example, if a biomass power plant operator only gets updates to their weather data at close of business each day, then making a forecast at midday on the plant energy output for the coming afternoon using a model requiring actual weather data for the just elapsed morning is not possible.
Even if an up-to-date stream of weather data is available, there may be cases where a forecast model is required to use weather forecasts rather than actuals. If the biomass plant operator wants a forecast model to predict the plant energy output for the coming afternoon based on the weather throughout the same afternoon, then forecast weather must be used as actuals are not available. The choice of forecast or actual variables as inputs to the model must be reflected in the data foundation of the model: machine learning models must be trained on similar data as used for the input. If forecast weather is used for input then forecast weather should be used in training, even though actual historical observations may be available at the time the model is trained.
For the second rule, it is tempting to think that you should always use actual weather values whenever they are available for use, particularly when trying to explain historical observations. However, it pays to consider the realities of the phenomenon being modelled. For example, suppose a theme park owner wants to understand the relationship between the weather and the number of on-door admissions sold each day for the last month. Then it may be profitable to look at what the forecast for that day was and not (just) what the actual weather was like – after all, people tend to make plans for outdoor ventures based on a weather forecast for the day, not on how the weather actually ends up unfolding.
Errors in forecasts
The use of weather forecasts as input data for a mathematical model raises an additional issue: any error in these forecasts will propagate through the models. When accuracy of these forecasts is desired, it is sensible to use the most up-to-date weather forecasts available as inputs (as long as the two golden rules are followed). This is justified by the fact that weather behaves in a chaotic fashion: small changes in the initial conditions can lead to large deviations in the behaviour of the weather later on. Furthermore, if the weather forecast models are improved then your model should be recalibrated on a new dataset containing the improved weather forecasts.
Data resolution considerations
At its most granular level, weather data consists of various metrics (temperature, humidity, wind speed, wind direction, pressure etc.) that are measured by sensors over time. Where these metrics are collected at a fixed geographic location, the data can be represented as time series. The dimensions of geography and time bring with them general considerations when using the data to construct models.
An important question this raises is: does your weather data provide information at the right level of geographical and temporal detail to effectively model the desired phenomenon? As with the question regarding use of forecasts or actuals, this can be split into both practical and theoretical considerations.
At the practical level, it may be that the weather data is only available at a limited level of granularity. For example, one might only have access to peak or average measurements over 24-hour periods, or geographic averages at a regional or even national level. Alternatively, it could be that the level of granularity of the weather data does not match well with that of other data you wish to incorporate into your model. For example, if studying the effects of weather on electricity generation throughout the UK, having weather data available for different weather stations throughout the UK is not very helpful if you cannot also attribute this level of geographical detail to the generation data.
At the theoretical level, the intended application can guide the appropriate level of data granularity, even when high geographical or temporal resolution is available. Sometimes it will make sense to use the full level of detail available. For example, if trying to forecast the energy output of a wind farm, then the weather local to the wind farm is clearly going to be more relevant than a national average. On other occasions, aggregation or averaging may be more appropriate to simplify a model. If the purpose of the model is to predict longer term trends (e.g. monthly theme park ticket sales over a year), then average daily readings may be more appropriate input variables than hourly readings. This is related to the question of feature engineering — the act of processing input variables — to be discussed in the next section.
Variable selection and feature engineering
There are a lot of variables that can constitute weather data: temperature, humidity, pressure, wind speed, wind direction, precipitation category (rain, sleet, snow), illumination, pollution index, etc. Each of these could be a potential input for a developing mathematical model. On top of this, it may be fruitful to transform some of the variables into new features, which are in turn fed in as an input to a certain class of statistical model. Such functions could arise from polynomial combinations of variables, logarithmically transforming variables, lagging of variables with respect to time, or combinations of these, such as moving averages.
This leads to a bewildering array of possible features. One of the keys to producing a good model is to choose transformations that capture features with high explanatory or predictive power of the dependent variable of interest (for example, sales or energy generation outputs). This subject of feature engineering is a challenging task that can either be automated as part of an algorithm, or informed by specialist domain knowledge of the area of model application. For example, if considering the question of how hot a person feels affects their behaviour at a theme park, then one might think to simply work with the raw (atmospheric) temperature. However, the temperature perceived by humans is also influenced by other factors, such as the humidity in the air and wind speed. So it may well be better to work with an index that combines some or all of these variables to arrive at a feature that better describes the thermal comfort of a person .
Weather data is often naturally encoded as a collection of time series. It is therefore worth considering whether this temporal structure can be leveraged in model construction, by making use of time series techniques. Autoregressive and moving average techniques seek to model variables based on the assumption that a variable’s value at a given point in time is closely related to its values shortly before that time. Alternatively, it might be that the timestamps in the weather data serve only to provide a means for mapping the data to other timestamped data, after which the time-series structure is not utilised. The wind farm is a good example where this can be appropriate: the energy generated between 3pm and 4pm, say, does not depend on how much it was generating in previous hours, but instead on the state of the weather, and other factors, between 3pm and 4pm.
Finally, while there is no shortage of weather data providers, it is not always cheap to acquire. It is worth considering variables that are free to compute, such as time of day and the day of the year. The combination of the two can have a surprisingly effective predictive or explanatory power in a mathematical model, acting as crude approximations of typical weather being experienced at a given time of day or year.
Conclusion
There is an increasing recognition of the value that can be unlocked from weather-driven mathematical models both to forecast and to explain. Such models require a clear understanding of the differences between using actual and forecast data, effective choice of geographical and temporal resolutions, and feature engineering built on domain knowledge that provides key information into the objects or phenomena of study. Such considerations lay the foundation for developing robust models that deliver real insight, come rain or shine.
If you have any thoughts, comments or would like to discuss weather-driven modelling, please get in touch with Dr Thomas Hawes.